I wanted to add some new features to my homepage and add something out of the ordinary. I had a few ideas I could work on.
- Fresh up my about page
- Overhaul my projects side and improve the visual appearance
- Add a gallery of some sort of recent events or trips from my life
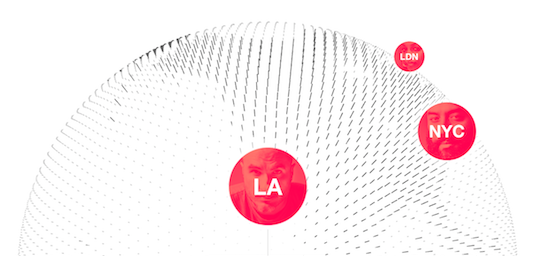
So then I thought a little bit about what would be the best way to impress people a little. So I decided to just have some sort of exciting looking visualization on my about page. By chance I came across the product page for Apple’s music streaming service.
They have a 3D model of the earth running with WebGL to visualize the locations of their radio recording studio’s and the upcoming performances on the Beats1 radio channel.
So this is how I got the idea to do something similar to visualize some places I visited and get a little ‘wow’-effect from people visiting my website.
Using WebGL and threejs
We start off using Google’s WebGL-Globe Chrome experiment.
This already gave me most of the necessary code to render a sphere and to position little marks on it based on a latitude and longitude.
It is based on three.js which allows me to draw very complex 3D scenes with lot’s of objects without neeing to care about WebGL specifics or a scene-graph.
The first real problem was to find a suitable model of the earth. At first I actually looked for a model which would feature a grid of dots, but couldn’t find any. So I turned back to apples implementation and looked at the resources they load to build their globe:
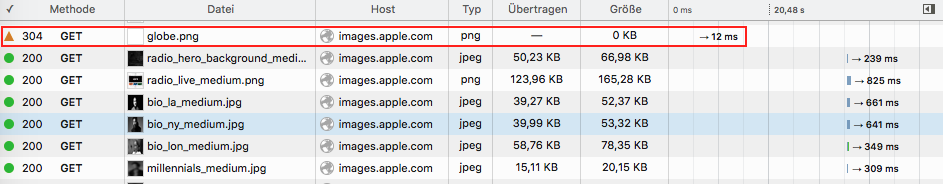
I immediatly noticed that they were loading a greyscale image of the eath’s surface, where all land was white and the oceans were grey. This is essentially a heightmap with only 2 values for land or water (Not sure if there is a different name for this kind of image).
What I needed to do was:
- Find and load a suitable image with a map of the earth’s surface
- Retrieve some pixel values from this image in periodic distances (Image sampling)
- For each sample check the value and determine if it’s supposed to be land or water
- Add either an dot or a ‘rod’ at the corresponding place on my 3D globe
Image loading and manipulation
First we need to load an image in JavaScript. This is easy enough, we use the Image object to asynchronously load an image with an height-map of the earth on it.
This unfortunately doesn’t give us access to the images content immediately. When we want to access each pixel values, we need to render it onto a canvas and then retrieve an ImageData object from the canvas. This works like this:
var globeImg = new Image();
globeImg.onload = function() {
    // In memory drawing to access pixel values
    var canvas = document.createElement('canvas');
    canvas.width = globeImg.width;
    canvas.height = globeImg.height;
    var context = canvas.getContext('2d');
    context.drawImage(globeImg, 0, 0);
    var mapData = context.getImageData(0, 0, globeImg.width, globeImg.height);
    // do something with the image data
};
globeImg.src = "https://graetzer.org/public/globe/globe.png";// starts the download immediately
To figure out which pixels to actually use, we need to look into the way the image actually displays the surface of the earth.
Equirectangular Map Projection
My map-image shows the earth’s surface as an Equirectangular projection. This means that the spherical surface of the earth is mapped to the flat surface of the image with a very simple linear formula. The distances in the image are basically equal to the latitude and longitude expect for a linear factor.
Now we can sample the pixel data from the image like this:
// We loop through mapData which contains the data of our image
for (let y = 0; y < mapData.height; y += 5) {

  for (let x = 0; x < mapData.width; x += 5) {
    // the data field contains an array in which the pixel values are stored
    // as 8bit values for each color channel. The layout looks like [R,G,B,A,R,G,B,A,R,G,B,A,...].
    // Therefore we need to calculate the right position to look for the pixel value we want to look at.
    let i = (y * mapData.width + x) * 4;
    // This is perfectly suitable to figure out how bright a pixel is
    let intensity = mapData.data[i] + mapData.data[i + 1] + mapData.data[i + 2];

    // We just linearly convert the image coordinated to the angular latitude and longitude coordinates.
    // Then we center them so the (0,0) coordinate is at the center of the image
    let lat = 90 - 180 * (y / mapData.height); // equirectangular projection
    let lng = 360 * (x / mapData.width) -180;
    if (intensity > 0x33 * 3) // For land every pixel contains the color #33
        addPoint(lat, lng, 0.8, 5);// add a rod for land
    else
        addPoint(lat, lng, 0.5, 1);// add a dot for water
  }
}
Adding Points
To add the actual point to the WebGL rendering we use the method that was convinietly provided by the Google’s globe project:
// This function adds a point to the WebGL scene mangaged by three.js
// point is just a box-model (THREE.BoxGeometry) that we will use
// for every point on the surface
function addPoint(lat, lng, xy, h) {
    // convert latitude / longitude to angles between 0 and 2*phi
    let phi = (90 - lat) * Math.PI / 180;
    let theta = (180 - lng) * Math.PI / 180;

    // Calculate the xyz coordinate from the angles
    point.position.x = 200 * Math.sin(phi) * Math.cos(theta);
    point.position.y = 200 * Math.cos(phi);
    point.position.z = 200 * Math.sin(phi) * Math.sin(theta);
    point.lookAt(mesh.position);// orient the point in the direction of the sphere center
    // scale the point to the right size
    point.scale.x = xy;// width
    point.scale.y = xy;// depth
    point.scale.z = h; // height
    point.updateMatrix();

    if (point.matrixAutoUpdate) {
      point.updateMatrix();
    }
    subgeo.merge(point.geometry, point.matrix);// add it to the other points
}
Dynamic Sample Spacing
This is actually not quite done yet. The points we choose initially don’t really look good on our model. The spacing is much to close near the earth’s poles. This is a side effect of the equirectangular map projection.
The map distorts the surface of the earth and uses too much space for the area’s near the north- or south-pole and uses too less space for everything else. You can see this very well on this map with some indicators painted on them:
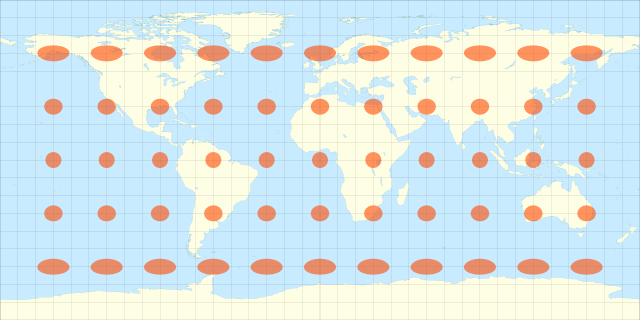
Therefore we need to adapt the placement of our samples a little bit and dynamically change the spacing. You can check out the code for this directly on github
Visualized the placements of my samples looks like this:
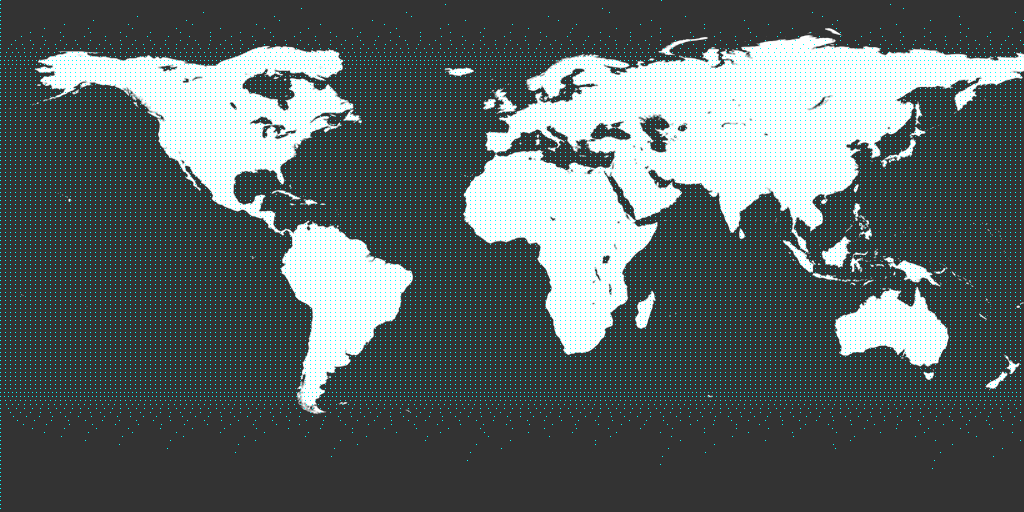
And that’s basically it! All other required modifications of google’s project were just the removal of unnecessary features like some custom shaders and changing some colours.
Check it out on my about page
Comment on this article